Architecture
Cleaning tools
MyForestplot prepares cleaning tools for preparing dataframe used for forestplot. These tools are mainly designed to use results of statsmodels results.
[1]:
import pandas as pd
import numpy as np
import matplotlib.pyplot as plt
%matplotlib inline
import statsmodels.api as sm
import statsmodels.formula.api as smf

import myforestplot as mfp

%load_ext autoreload
%autoreload 2

%load_ext watermark
%watermark -n -u -v -iv -w -p graphviz
Last updated: Thu Sep 15 2022

Python implementation: CPython
Python version       : 3.9.7
IPython version      : 8.0.1

graphviz: not installed

myforestplot: 0.2.1
numpy       : 1.21.5
pandas      : 1.4.1
statsmodels : 0.13.2
matplotlib  : 3.5.1

Watermark: 2.3.1
[2]:
data = pd.read_csv("titanic.csv")
data = data[["survived", "pclass", "sex", "age", "embark_town"]]
data = data.dropna()
res = smf.logit("survived ~ sex + age + embark_town", data=data).fit()
Optimization terminated successfully.
         Current function value: 0.509889
         Iterations 6
statsmodels_pretty_result_dataframe
This function converts statsmodelsresult into dataframe shape, adding number of observations for each category.
[3]:
order = ["age", "sex", "embark_town"]
cont_cols = ["age"]
item_order = {"embark_town": ['Southampton', 'Cherbourg', 'Queenstown']}
df = mfp.statsmodels_pretty_result_dataframe(data, res,
                                             order=order,
                                             cont_cols=cont_cols,
                                             item_order=item_order,
                                             fml=".3f",
                                             )
df
[3]:
| category | item | 0 | 1 | risk | nobs | risk_pretty | |
|---|---|---|---|---|---|---|---|
| 3 | age | age | 0.979300 | 1.004771 | 0.991954 | NaN | 0.99 (0.98, 1.00) |
| 0 | sex | male | 0.057848 | 0.122213 | 0.084082 | 453.0 | 0.08 (0.06, 0.12) |
| 4 | sex | female | NaN | NaN | NaN | 259.0 | Ref. |
| 2 | embark_town | Southampton | 0.229654 | 0.581167 | 0.365332 | 554.0 | 0.37 (0.23, 0.58) |
| 5 | embark_town | Cherbourg | NaN | NaN | NaN | 130.0 | Ref. |
| 1 | embark_town | Queenstown | 0.057027 | 0.464428 | 0.162742 | 28.0 | 0.16 (0.06, 0.46) |
“statsmodels_pretty_result_dataframe” is made up of 5 steps. 1. Convert statasmodels results into dataframe.
[4]:
df_res = mfp.statsmodels_fitting_result_dataframe(res, alpha=0.05, accessor=np.exp)
df_res
[4]:
| category | item | 0 | 1 | risk | |
|---|---|---|---|---|---|
| 1 | sex | male | 0.057848 | 0.122213 | 0.084082 |
| 2 | embark_town | Queenstown | 0.057027 | 0.464428 | 0.162742 |
| 3 | embark_town | Southampton | 0.229654 | 0.581167 | 0.365332 |
| 4 | age | age | 0.979300 | 1.004771 | 0.991954 |
If you want to obtain raw results, set accessor as lambda x: x
[5]:
df_res2 = mfp.statsmodels_fitting_result_dataframe(res, alpha=0.05, accessor=lambda x: x)
df_res2
[5]:
| category | item | 0 | 1 | risk | |
|---|---|---|---|---|---|
| 1 | sex | male | -2.849937 | -2.101986 | -2.475962 |
| 2 | embark_town | Queenstown | -2.864233 | -0.766950 | -1.815592 |
| 3 | embark_town | Southampton | -1.471180 | -0.542717 | -1.006949 |
| 4 | age | age | -0.020917 | 0.004760 | -0.008079 |
Obtain number of observations for each category variable.
[6]:
cate_cols = [c for c in order if not c in cont_cols]
df_nobs = mfp.count_category_frequency(data, cate_cols)
df_nobs
[6]:
| category | item | nobs | |
|---|---|---|---|
| 0 | sex | male | 453 |
| 1 | sex | female | 259 |
| 2 | embark_town | Southampton | 554 |
| 3 | embark_town | Cherbourg | 130 |
| 4 | embark_town | Queenstown | 28 |
Merge statsmodels resutl and dataframe of number of observations.
[7]:
df_sum = pd.merge(df_res, df_nobs, on=["category", "item"], validate="1:1", how="outer")
df_sum
[7]:
| category | item | 0 | 1 | risk | nobs | |
|---|---|---|---|---|---|---|
| 0 | sex | male | 0.057848 | 0.122213 | 0.084082 | 453.0 |
| 1 | embark_town | Queenstown | 0.057027 | 0.464428 | 0.162742 | 28.0 |
| 2 | embark_town | Southampton | 0.229654 | 0.581167 | 0.365332 | 554.0 |
| 3 | age | age | 0.979300 | 1.004771 | 0.991954 | NaN |
| 4 | sex | female | NaN | NaN | NaN | 259.0 |
| 5 | embark_town | Cherbourg | NaN | NaN | NaN | 130.0 |
Sort items.
[8]:
df_sum = mfp.sort_category_item(df_sum, order=order, item_order=item_order)
df_sum
[8]:
| category | item | 0 | 1 | risk | nobs | |
|---|---|---|---|---|---|---|
| 3 | age | age | 0.979300 | 1.004771 | 0.991954 | NaN |
| 0 | sex | male | 0.057848 | 0.122213 | 0.084082 | 453.0 |
| 4 | sex | female | NaN | NaN | NaN | 259.0 |
| 2 | embark_town | Southampton | 0.229654 | 0.581167 | 0.365332 | 554.0 |
| 5 | embark_town | Cherbourg | NaN | NaN | NaN | 130.0 |
| 1 | embark_town | Queenstown | 0.057027 | 0.464428 | 0.162742 | 28.0 |
Add pretty styles of risk results.
[9]:
df_sum["risk_pretty"] = mfp.add_pretty_risk_column(df_sum,
                                                   risk="risk",
                                                   lower=0,
                                                   upper=1,
                                                   fml=".2f"
                                                   )
df_sum
[9]:
| category | item | 0 | 1 | risk | nobs | risk_pretty | |
|---|---|---|---|---|---|---|---|
| 3 | age | age | 0.979300 | 1.004771 | 0.991954 | NaN | 0.99 (0.98, 1.00) |
| 0 | sex | male | 0.057848 | 0.122213 | 0.084082 | 453.0 | 0.08 (0.06, 0.12) |
| 4 | sex | female | NaN | NaN | NaN | 259.0 | Ref. |
| 2 | embark_town | Southampton | 0.229654 | 0.581167 | 0.365332 | 554.0 | 0.37 (0.23, 0.58) |
| 5 | embark_town | Cherbourg | NaN | NaN | NaN | 130.0 | Ref. |
| 1 | embark_town | Queenstown | 0.057027 | 0.464428 | 0.162742 | 28.0 | 0.16 (0.06, 0.46) |
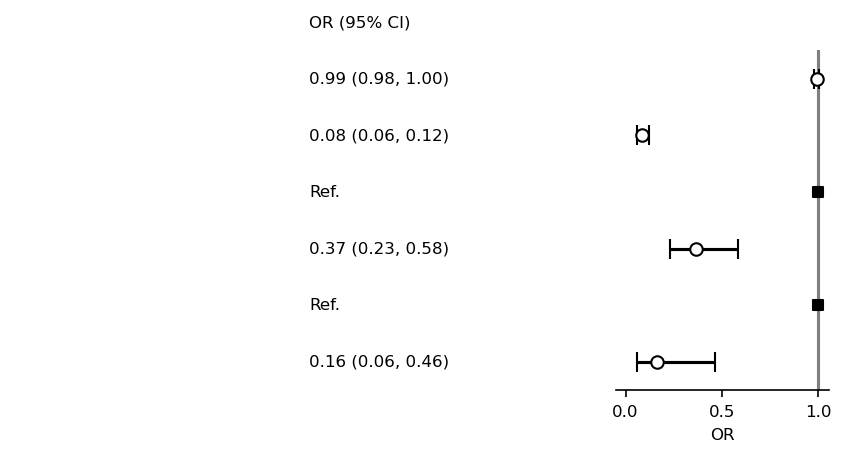
SimpleForestPlot
The following is an illustration of how myforestplot works.
[10]:
df = df_sum.copy()
[11]:
plt.rcParams["font.size"] = 8
fp = mfp.SimpleForestPlot(ratio=(8,3), dpi=150, figsize=(7,3), df=df)
fp.errorbar(errorbar_kwds=None)
fp.ax2.set_xlabel("OR")
fp.ax2.axvline(x=1, ymin=0, ymax=1.0, color="black", alpha=0.5)
fp.embed_strings("risk_pretty", 0.5, header="OR (95% CI)")

plt.show()
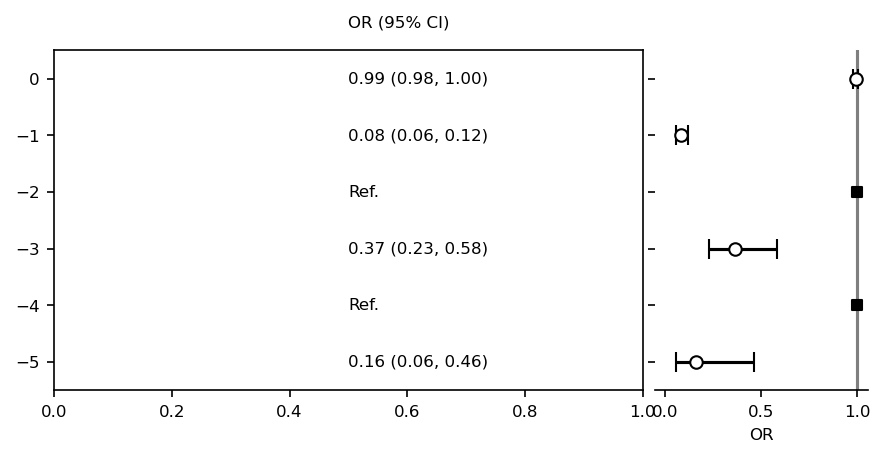
BaseForestplot uses Gridspect to create 2 axes. One is for text, and one is for errorbar plot. To draw original axis ticks and labels for two axes.
[12]:
plt.rcParams["font.size"] = 8
fp = mfp.SimpleForestPlot(ratio=(8,3), dpi=150, figsize=(7,3), df=df,
                        yticks_show=True,
                        yticklabels_show=True,
                        xticks_show=True,
                        text_axis_off=False)
fp.errorbar(errorbar_kwds=None)
fp.ax2.set_xlabel("OR")
fp.ax2.axvline(x=1, ymin=0, ymax=1.0, color="black", alpha=0.5)
fp.embed_strings("risk_pretty", 0.5, header="OR (95% CI)")

plt.show()
Also see Gallery section to know what kind of designs are available.
[ ]: