SimpleForestPlot
[1]:
import pandas as pd
import numpy as np
import matplotlib.pyplot as plt
%matplotlib inline
import statsmodels.api as sm
import statsmodels.formula.api as smf

import myforestplot as mfp

%load_ext autoreload
%autoreload 2

%load_ext watermark
%watermark -n -u -v -iv -w -p graphviz
Last updated: Thu Sep 22 2022

Python implementation: CPython
Python version       : 3.9.7
IPython version      : 8.0.1

graphviz: not installed

statsmodels : 0.13.2
myforestplot: 0.2.2
matplotlib  : 3.5.1
numpy       : 1.21.5
pandas      : 1.4.1

Watermark: 2.3.1
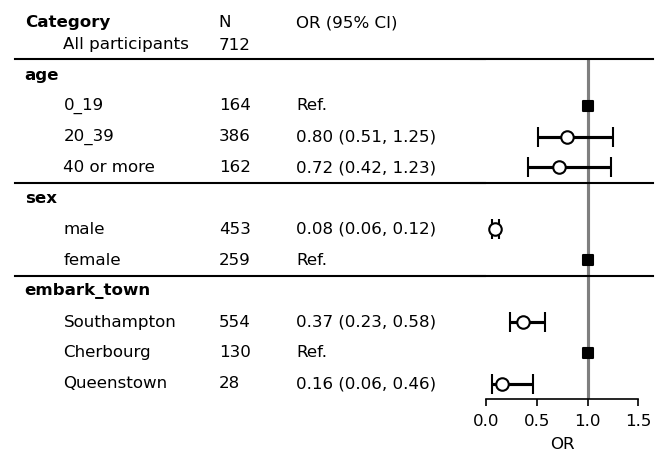
Label names, ORs, left side spines, and ylabel ticks
[2]:
# Sample data preparation
data = (pd.read_csv("titanic.csv")
      [["survived", "pclass", "sex", "age", "embark_town"]]
      .dropna()
      )

ser = data["age"]
data["age"] = (ser
             .mask(ser >= 40, "40 or more")
             .mask(ser < 40, "20_39")
             .mask(ser <20, "0_19")
             )
# Fit logistic regression
res = smf.logit("survived ~ sex + age + embark_town", data=data).fit()

order = ["age", "sex", "embark_town"]
cont_cols = []
item_order = {"embark_town": ['Southampton', 'Cherbourg', 'Queenstown'],
              "age": ["0_19", "20_39", "40 or more"]
              }
df_res = mfp.statsmodels_pretty_result_dataframe(data, res,
                                             order=order,
                                             cont_cols=cont_cols,
                                             item_order=item_order,
                                             fml=".3f",
                                             )
df = df_res.copy()
Optimization terminated successfully.
         Current function value: 0.509862
         Iterations 6
[3]:
df
[3]:
| category | item | 0 | 1 | risk | pvalues | nobs | risk_pretty | |
|---|---|---|---|---|---|---|---|---|
| 5 | age | 0_19 | NaN | NaN | NaN | NaN | 164 | Ref. |
| 1 | age | 20_39 | 0.509199 | 1.251529 | 0.798296 | 3.261178e-01 | 386 | 0.80 (0.51, 1.25) |
| 2 | age | 40 or more | 0.415780 | 1.230498 | 0.715274 | 2.260468e-01 | 162 | 0.72 (0.42, 1.23) |
| 0 | sex | male | 0.057797 | 0.122138 | 0.084019 | 1.684205e-38 | 453 | 0.08 (0.06, 0.12) |
| 6 | sex | female | NaN | NaN | NaN | NaN | 259 | Ref. |
| 4 | embark_town | Southampton | 0.229981 | 0.582518 | 0.366016 | 2.242381e-05 | 554 | 0.37 (0.23, 0.58) |
| 7 | embark_town | Cherbourg | NaN | NaN | NaN | NaN | 130 | Ref. |
| 3 | embark_town | Queenstown | 0.055646 | 0.457460 | 0.159549 | 6.374344e-04 | 28 | 0.16 (0.06, 0.46) |
[4]:
plt.rcParams["font.size"] = 8
fp = mfp.SimpleForestPlot(ratio=(8,3), dpi=150, figsize=(5,3),
                        df=df, vertical_align=True)
fp.errorbar(errorbar_kwds=None)
fp.ax2.set_xlim([0, 1.5])
fp.ax2.set_xticks([0, 0.5, 1, 1.5])
fp.ax2.set_xlabel("OR")
fp.ax2.axvline(x=1, ymin=0, ymax=1.0, color="black", alpha=0.5)

fp.ax1.set_xlim([0.35, 1])
y_header=1.7
fp.embed_cate_strings("category", 0.30, header="Category",
                 text_kwds=dict(fontweight="bold"),
                 header_kwds=dict(fontweight="bold"),
                 y_header=y_header
                 )
fp.embed_strings("item", 0.36, header="All participants", replace={"age":""})
fp.embed_strings("nobs", 0.60, header="N", y_header=y_header)
fp.ax1.text(0.60, 0.8, "712")
fp.embed_strings("risk_pretty", 0.72, header="OR (95% CI)", y_header=y_header)
fp.horizontal_variable_separators()
plt.show()
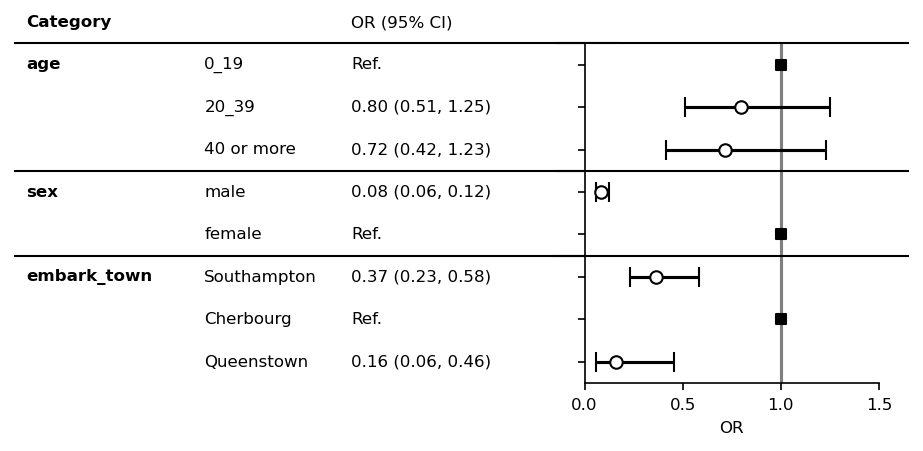
[5]:
plt.rcParams["font.size"] = 8
fp = mfp.SimpleForestPlot(ratio=(5,3),
                    figsize=(7,3),
                    dpi=150,
                    df=df,
                    hide_spines=["top", "right"],
                    yticks_show=True)

fp.errorbar()
fp.ax2.set_xlim([0, 1.5])
fp.ax2.set_xticks([0, 0.5, 1, 1.5])
fp.ax2.set_xlabel("OR")
fp.ax2.axvline(x=1, ymin=0, ymax=1.0, color="black", alpha=0.5)

fp.ax1.set_xlim([0.35, 1])
method = getattr(fp.ax1, "set_xlim")
method([0.35, 1])
fp.embed_strings("category", 0.3, header="Category",
                 duplicate_hide=True,
                 text_kwds=dict(fontweight="bold"),
                 header_kwds=dict(fontweight="bold")
                 )
fp.embed_strings("item", 0.53, header="", replace={"age":""})
fp.embed_strings("risk_pretty", 0.72, header="OR (95% CI)")
fp.horizontal_variable_separators()
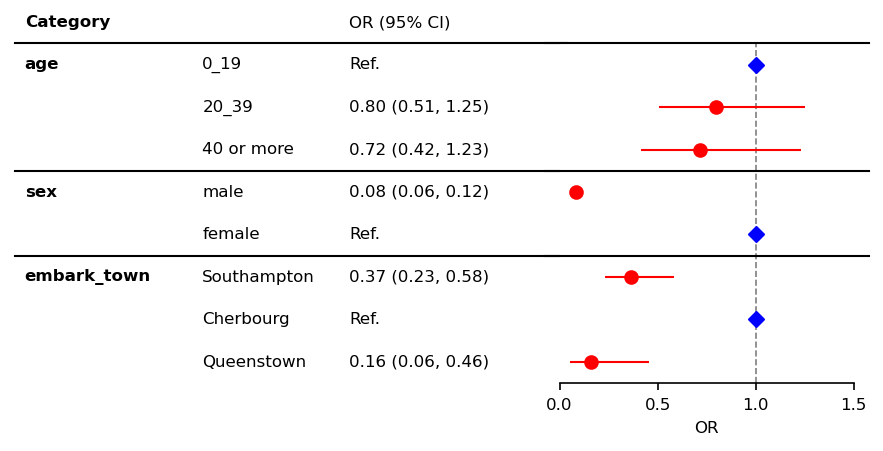
Change styles of errorbars and horizontal lines
[6]:
plt.rcParams["font.size"] = 8
errorbar_kwds = dict(capsize=0,
                     lw=1,
                     markeredgecolor="red",
                     ecolor="red",
                     color='red'
                     )
ref_kwds = dict(marker="D", s=26, color="blue")

fp = mfp.SimpleForestPlot(ratio=(5,3),
                    figsize=(7,3),
                    dpi=150,
                    df=df,
                    )
fp.errorbar(errorbar_kwds=errorbar_kwds, ref_kwds=ref_kwds)
fp.ax2.set_xlim([0, 1.5])
fp.ax2.set_xticks([0, 0.5, 1, 1.5])
fp.ax2.set_xlabel("OR")
fp.ax2.axvline(x=1, ymin=0, ymax=1.0,
               color="black", alpha=0.5, ls="--", lw=0.8)

fp.ax1.set_xlim([0.35, 1])
fp.embed_strings("category", 0.33, header="Category",
                 duplicate_hide=True,
                 text_kwds=dict(fontweight="bold"),
                 header_kwds=dict(fontweight="bold")
                 )
fp.embed_strings("item", 0.56, header="", replace={"age":""})
fp.embed_strings("risk_pretty", 0.75, header="OR (95% CI)")
fp.horizontal_variable_separators(scale=0.05)
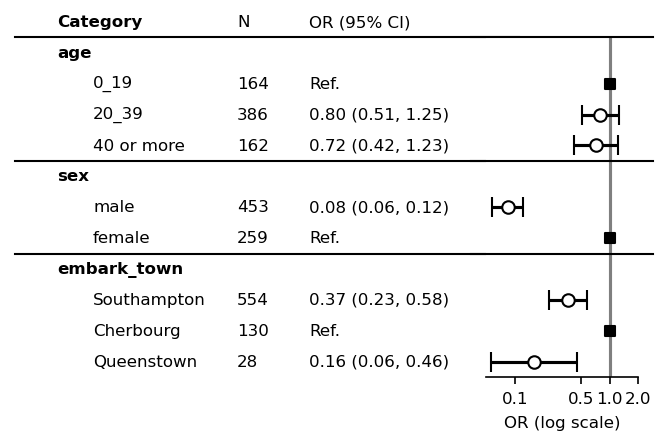
Log scale with vertical align of categories
Values are converted with np.log so that ticks should be edited by similarly np.log.
[7]:
plt.rcParams["font.size"] = 8
fp = mfp.SimpleForestPlot(ratio=(8,3), dpi=150, figsize=(5,3), df=df,
                          vertical_align=True)
fp.errorbar(errorbar_kwds=None, log_scale=True)

xticklabels = [0.1, 0.5, 1.0, 2.0]
fp.ax2.set_xlim(np.log([0.05, 1.5]))
fp.ax2.set_xticks(np.log(xticklabels))
fp.ax2.set_xticklabels(xticklabels)
fp.ax2.set_xlabel("OR (log scale)")
fp.ax2.axvline(x=0, ymin=0, ymax=1.0, color="black", alpha=0.5)

fp.ax1.set_xlim([0.3, 1])
fp.embed_cate_strings("category", 0.3, header="Category",
                      text_kwds=dict(fontweight="bold"),
                      header_kwds=dict(fontweight="bold")
                      )
fp.embed_strings("item", 0.36, header="", replace={"age":""})
fp.embed_strings("nobs", 0.60, header="N")
fp.embed_strings("risk_pretty", 0.72, header="OR (95% CI)")
fp.horizontal_variable_separators()
plt.show()
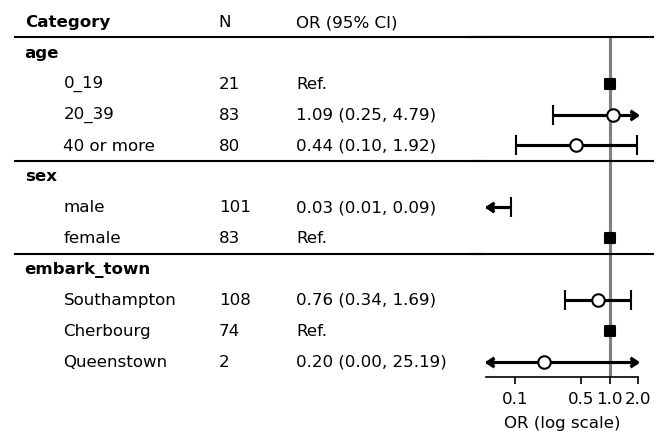
Draw markers for outer range of confidence intervals
In default, draw_outer_marker put triangles to indicate outer range of confidence intervals.
[8]:
# Sample data preparation
data = (pd.read_csv("titanic.csv")
      [["survived", "pclass", "sex", "age", "embark_town", "class"]]
      .dropna()
      )

ser = data["age"]
data["age"] = (ser
             .mask(ser >= 40, "40 or more")
             .mask(ser < 40, "20_39")
             .mask(ser <20, "0_19")
             )
# Fit logistic regression
data1 = data[data["class"] == "First"]
res1 = smf.logit("survived ~ sex + age + embark_town", data=data1).fit()
order = ["age", "sex", "embark_town"]
cont_cols = []
item_order = {"embark_town": ['Southampton', 'Cherbourg', 'Queenstown'],
              "age": ["0_19", "20_39", "40 or more"]
              }

df = mfp.statsmodels_pretty_result_dataframe(data1, res1,
                                             order=order,
                                             cont_cols=cont_cols,
                                             item_order=item_order,
                                             fml=".3f",
                                             )
Optimization terminated successfully.
         Current function value: 0.421597
         Iterations 7
[9]:
plt.rcParams["font.size"] = 8
fp = mfp.SimpleForestPlot(ratio=(8,3), dpi=150, figsize=(5,3), df=df,
                          vertical_align=True)
fp.errorbar(errorbar_kwds=None, log_scale=True)

xticklabels = [0.1, 0.5, 1.0, 2.0]
fp.ax2.set_xlim(np.log([0.05, 1.5]))
fp.ax2.set_xticks(np.log(xticklabels))
fp.ax2.set_xticklabels(xticklabels)
fp.ax2.set_xlabel("OR (log scale)")
fp.ax2.axvline(x=0, ymin=0, ymax=1.0, color="black", alpha=0.5)

fp.ax1.set_xlim([0.35, 1])
fp.embed_cate_strings("category", 0.3, header="Category",
                      text_kwds=dict(fontweight="bold"),
                      header_kwds=dict(fontweight="bold")
                      )
fp.embed_strings("item", 0.36, header="", replace={"age":""})
fp.embed_strings("nobs", 0.60, header="N")
fp.embed_strings("risk_pretty", 0.72, header="OR (95% CI)")
fp.horizontal_variable_separators()
fp.draw_outer_marker(log_scale=True, scale=0.008)
plt.show()
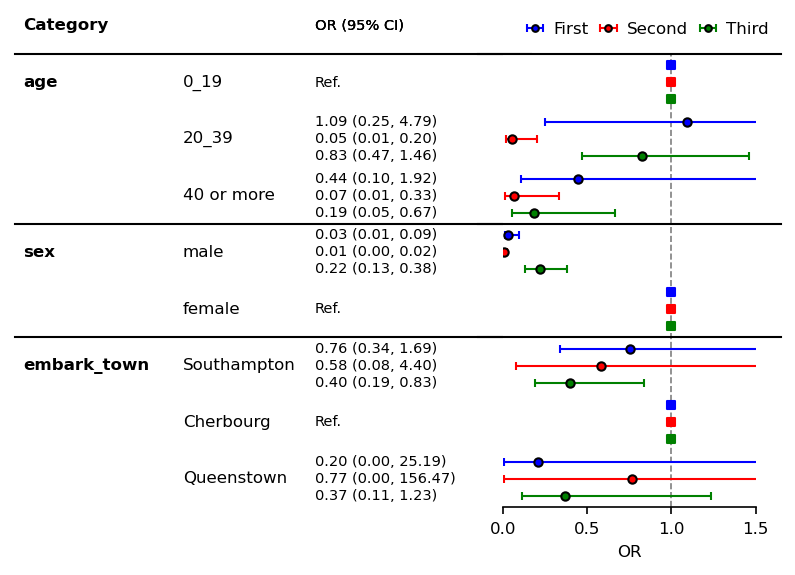
Multiple confidence bands
[10]:
# Sample data preparation
data = (pd.read_csv("titanic.csv")
      [["survived", "pclass", "sex", "age", "embark_town", "class"]]
      .dropna()
      )

ser = data["age"]
data["age"] = (ser
             .mask(ser >= 40, "40 or more")
             .mask(ser < 40, "20_39")
             .mask(ser <20, "0_19")
             )
# Fit logistic regression
df = pd.DataFrame()
for item in ["First", "Second", "Third"]:
    dataM = data[data["class"] == item]
    res = smf.logit("survived ~ sex + age + embark_town", data=dataM).fit()

    order = ["age", "sex", "embark_town"]
    cont_cols = []
    item_order = {"embark_town": ['Southampton', 'Cherbourg', 'Queenstown'],
                  "age": ["0_19", "20_39", "40 or more"]
                  }

    dfM = mfp.statsmodels_pretty_result_dataframe(dataM, res,
                                                 order=order,
                                                 cont_cols=cont_cols,
                                                 item_order=item_order,
                                                 fml=".3f",
                                                 )
    dfM["strf"] = item
    df = pd.concat((df, dfM))
df1 = df[df["strf"] == "First"]
Optimization terminated successfully.
         Current function value: 0.421597
         Iterations 7
Optimization terminated successfully.
         Current function value: 0.295225
         Iterations 7
Optimization terminated successfully.
         Current function value: 0.476894
         Iterations 7
[11]:
plt.rcParams["font.size"] = 8
errorbar_kwds = dict(capsize=2,  lw=1, markersize=4)
ref_kwds = dict(s=13)

fp = mfp.SimpleForestPlot(ratio=(5,3),
                          figsize=(6,4),
                          dpi=150,
                          df=df1,
                          # From this dataframe, y_index is specified.
                          )
order = ["First", "Second", "Third"]
fp.v_multi_errorbar(
    df=df,
    by="strf",
    order=order,
    scale=0.3,
    multi_kwds=dict(
        label=order,
        errorbar_color=["blue", "red", "green"],
        ref_color=["blue", "red", "green"],
    ),
    errorbar_kwds=errorbar_kwds,
    ref_kwds=ref_kwds,
)

plt.legend(bbox_to_anchor=(-0.0,1.105),
           loc="upper left",
           ncol=3,
           markerscale=0.8,
           frameon=False,
           handletextpad=.1,
           columnspacing=.2)

fp.ax2.set_xlim([0.0, 1.5])
fp.ax2.set_xticks([0, 0.5, 1, 1.5])
fp.ax2.set_xlabel("OR")
fp.ax2.axvline(x=1, ymin=0, ymax=1.0,
               color="black", alpha=0.5, ls="--", lw=0.8)

fp.ax1.set_xlim([0.38, 1])
fp.embed_strings("category", 0.33, header="Category",
                 duplicate_hide=True,
                 text_kwds=dict(fontweight="bold"),
                 header_kwds=dict(fontweight="bold")
                 )
fp.embed_strings("item", 0.56, header="", replace={"age":""})
fontsize = 7
x = 0.75
fp.v_multi_embed_strings("risk_pretty", x,
                         df=df, by="strf", order=order,
                         scale=0.3,
                         header="OR (95% CI)",
                         fontsize=fontsize,
                         multi_kwds=dict(
                             replace=[{"Ref.":""},{},{"Ref.":""}],
                         ))
fp.horizontal_variable_separators()
For adjustment of legends spacing, see this thread.
You can also create this figure with lower level of methods.
[12]:
df1 = df[df["strf"] == "First"]
df2 = df[df["strf"] == "Second"]
df3 = df[df["strf"] == "Third"]
[13]:
plt.rcParams["font.size"] = 8
errorbar_kwds = dict(capsize=2,  lw=1, markersize=4)
ref_kwds = dict(s=13)

fp = mfp.SimpleForestPlot(ratio=(5,3),
                          figsize=(6,4),
                          dpi=150,
                          df=df1,
                          # From this dataframe, y_index is specified.
                          )
order = ["First", "Second", "Third"]
fp.errorbar(errorbar_kwds=errorbar_kwds,
            ref_kwds=ref_kwds,
            y_adj=0.3,
            errorbar_color="blue",
            ref_color="blue",
            label="First",
            )
fp.errorbar(errorbar_kwds=errorbar_kwds,
            ref_kwds=ref_kwds,
            df=df2,
            y_adj=0,
            errorbar_color="red",
            ref_color="red",
            label="Second",
            )
fp.errorbar(errorbar_kwds=errorbar_kwds,
            ref_kwds=ref_kwds,
            df=df3,
            y_adj=-0.3,
            errorbar_color="green",
            ref_color="green",
            label="Third",
            )
plt.legend(bbox_to_anchor=(-0.0,1.105),
           loc="upper left",
           ncol=3,
           markerscale=0.8,
           frameon=False,
           handletextpad=.1,
           columnspacing=.2)

fp.ax2.set_xlim([0.0, 1.5])
fp.ax2.set_xticks([0, 0.5, 1, 1.5])
fp.ax2.set_xlabel("OR")
fp.ax2.axvline(x=1, ymin=0, ymax=1.0,
               color="black", alpha=0.5, ls="--", lw=0.8)

fp.ax1.set_xlim([0.38, 1])
fp.embed_strings("category", 0.33, header="Category",
                 duplicate_hide=True,
                 text_kwds=dict(fontweight="bold"),
                 header_kwds=dict(fontweight="bold")
                 )
fp.embed_strings("item", 0.56, header="", replace={"age":""})
fontsize = 7
x = 0.75
fp.embed_strings("risk_pretty", x, header="OR (95% CI)",
                 fontsize=fontsize,
                 df=df1, y_adj=0.3, replace={"Ref.":""})
fp.embed_strings("risk_pretty", x, header="OR (95% CI)",
                 fontsize=fontsize,
                 df=df2, y_adj=0.0, replace={})
fp.embed_strings("risk_pretty", x, header="OR (95% CI)",
                 fontsize=fontsize,
                 df=df3, y_adj=-0.3, replace={"Ref.":""})
fp.horizontal_variable_separators()

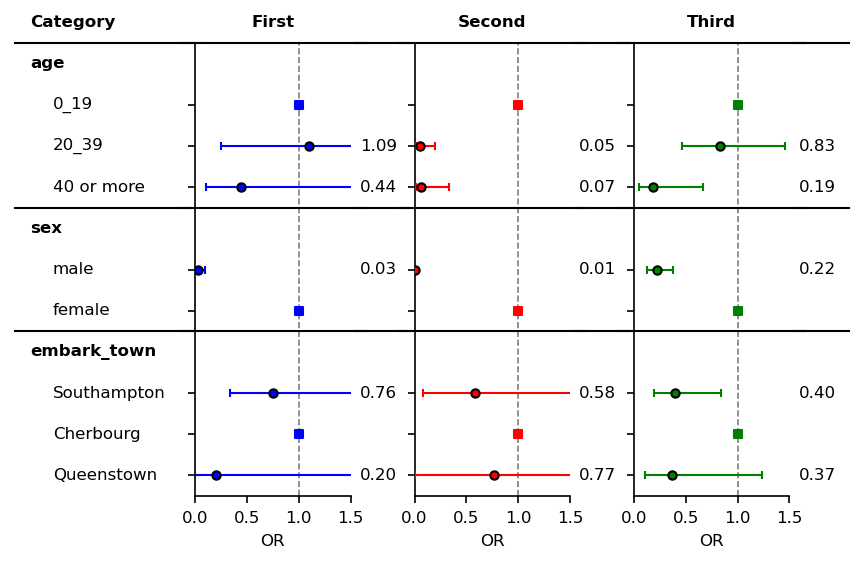
ForestPlot
Stratifiled forest plot
[14]:
# Sample data preparation
data = (pd.read_csv("titanic.csv")
      [["survived", "pclass", "sex", "age", "embark_town", "class"]]
      .dropna()
      )

ser = data["age"]
data["age"] = (ser
             .mask(ser >= 40, "40 or more")
             .mask(ser < 40, "20_39")
             .mask(ser <20, "0_19")
             )
# Fit logistic regression
df = pd.DataFrame()
for item in ["First", "Second", "Third"]:
    dataM = data[data["class"] == item]
    res = smf.logit("survived ~ sex + age + embark_town", data=dataM).fit()

    order = ["age", "sex", "embark_town"]
    cont_cols = []
    item_order = {"embark_town": ['Southampton', 'Cherbourg', 'Queenstown'],
                  "age": ["0_19", "20_39", "40 or more"]
                  }

    dfM = mfp.statsmodels_pretty_result_dataframe(dataM, res,
                                                 order=order,
                                                 cont_cols=cont_cols,
                                                 item_order=item_order,
                                                 fml=".3f",
                                                 )
    dfM["strf"] = item
    df = pd.concat((df, dfM))
df["risk_only"] = df["risk"].apply(lambda x : f"{x:.2f}").replace("nan", "")
df1 = df[df["strf"] == "First"]
Optimization terminated successfully.
         Current function value: 0.421597
         Iterations 7
Optimization terminated successfully.
         Current function value: 0.295225
         Iterations 7
Optimization terminated successfully.
         Current function value: 0.476894
         Iterations 7
[15]:
plt.rcParams["font.size"] = 8
errorbar_kwds = dict(capsize=2,  lw=1, markersize=4)
ref_kwds = dict(s=13)

fp = mfp.ForestPlot(ratio=(3,3,1,3,1,3,1),
                    fig_ax_index=[2,4,6],
                    figsize=(7,4),
                    dpi=150,
                    df=df1,
                    vertical_align=True,
                    yticks_show=True,
                    hide_spines=["top", "right"],
                    )
order = ["First", "Second", "Third"]
fp.h_multi_errorbar(
    df=df,
    by="strf",
    order = order,
    multi_kwds=dict(
        errorbar_color=["blue", "red", "green"],
        ref_color=["blue", "red", "green"],
    ),
    errorbar_kwds=errorbar_kwds,
    ref_kwds=ref_kwds,
)
fp.ax_method_to_figs("set_xlim", [0.0, 1.5])
fp.ax_method_to_figs("set_xlabel", "OR")
fp.ax_method_to_figs("axvline",
                     x=1, ymin=0, ymax=1.0,
                     color="black", alpha=0.5,
                     ls="--", lw=0.8)

for ax_ind, title in zip([2,4,6], order):
    ax = fp.axd[ax_ind]
    xmin, xmax = ax.get_xlim()
    ax.text((xmax + xmin)/2, 1.0, title,
            ha="center", va="center",
            fontweight="bold")

fp.axd[1].set_xlim([0.65, 1])
fp.embed_cate_strings(1,"category", 0.65, header="Category",
                      text_kwds=dict(fontweight="bold"),
                      header_kwds=dict(fontweight="bold")
                      )
fp.embed_strings(1, "item", 0.7, header="", replace={"age":""})
fp.h_multi_embed_strings([3, 5, 7], "risk_only", 0.0,
                         df=df, by="strf", order=order)
fp.horizontal_variable_separators()

Also, you can creat the same figure by using lower level of components.
[16]:
df1 = df[df["strf"] == "First"]
df2 = df[df["strf"] == "Second"]
df3 = df[df["strf"] == "Third"]
[17]:
plt.rcParams["font.size"] = 8
errorbar_kwds = dict(capsize=2,  lw=1, markersize=4)
ref_kwds = dict(s=13)

fp = mfp.ForestPlot(ratio=(3,3,1,3,1,3,1),
                    fig_ax_index=[2,4,6],
                    figsize=(7,4),
                    dpi=150,
                    df=df1,
                    vertical_align=True,
                    yticks_show=True,
                    hide_spines=["top", "right"],
                    )
fp.errorbar(index=2,
            errorbar_kwds=errorbar_kwds,
            ref_kwds=ref_kwds,
            errorbar_color="blue",
            ref_color="blue",
            )
fp.errorbar(index=4,
            errorbar_kwds=errorbar_kwds,
            ref_kwds=ref_kwds,
            df=df2,
            errorbar_color="red",
            ref_color="red",
            )
fp.errorbar(index=6,
            errorbar_kwds=errorbar_kwds,
            ref_kwds=ref_kwds,
            df=df3,
            errorbar_color="green",
            ref_color="green",
            )

for ax_ind, title in zip([2,4,6], ["First", "Second", "Third"]):
    ax = fp.axd[ax_ind]
    ax.set_xlim([0.0, 1.5])
    ax.set_xlabel("OR")
    ax.axvline(x=1, ymin=0, ymax=1.0,
               color="black", alpha=0.5,
               ls="--", lw=0.8)
    xmin, xmax = ax.get_xlim()
    ax.text((xmax + xmin)/2, 1.0, title,
            ha="center", va="center",
            fontweight="bold")

fp.axd[1].set_xlim([0.65, 1])
fp.embed_cate_strings(1,"category", 0.65, header="Category",
                      text_kwds=dict(fontweight="bold"),
                      header_kwds=dict(fontweight="bold")
                      )
fp.embed_strings(1, "item", 0.7, header="", replace={"age":""})
x = 0.0
fp.embed_strings(3,"risk_only", x, df=df1)
fp.embed_strings(5,"risk_only", x, df=df2)
fp.embed_strings(7,"risk_only", x, df=df3)
fp.horizontal_variable_separators()